A new high-resolution storm surge modeling system developed by New York Sea Grant scientists will better be able to predict flood levels and when flooding will occur during storm surges that strike New York City.
As reported in the June 2008 Bulletin of the American Meteorological Society, the researchers coupled a state-of the art atmospheric model with an ocean model from the Stony Brook Storm Surge system in order to predict NYC storm surges.
By testing their combined model against a severe nor’easter and a tropical storm, the scientists found the model predicted peak water levels comparable (within 10 percent) to those measured during the storms at several regional water level gauges. The Stony Brook Storm Surge Team also performed simulations to assess the impact of local tide level and wind intensity on flooding severity. The model’s advantage over existing predictive models is its use of a high resolution, 12-kilometer grid.
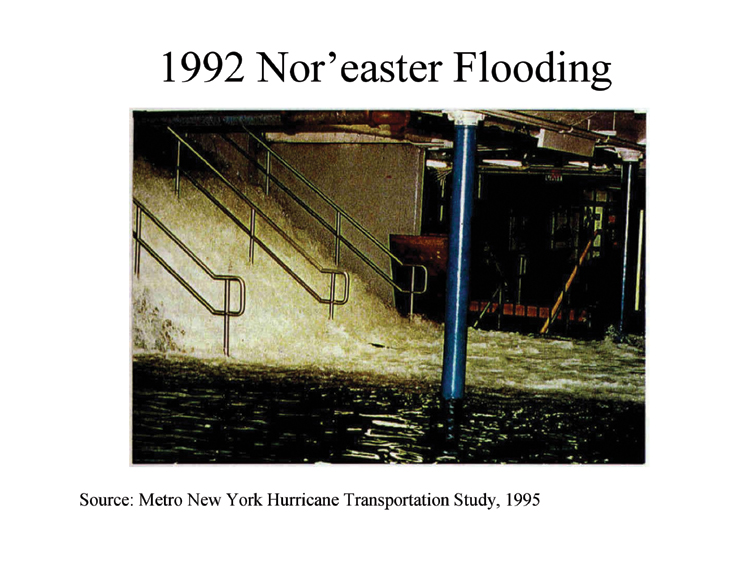
Storm surge flooding could threaten billions of dollars in property and have a grave impact on the lives of the millions of people who live in metropolitan New York. Says the Port Authority of New York and New Jersey's Chief Engineer, Frank Lombardi, "As the Port Authority moves forward in developing adaptive strategies to climate change, it is clear that tools such as the storm surge modeling system developed by the Stony Brook Team are invaluable to planners, designers and policy makers responsible for public transportation infrastructure." — Barbara A. Branca
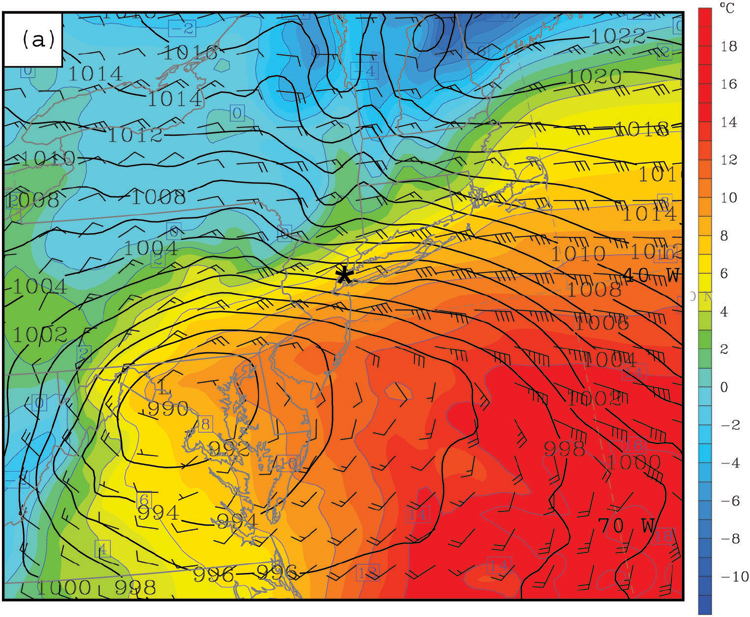
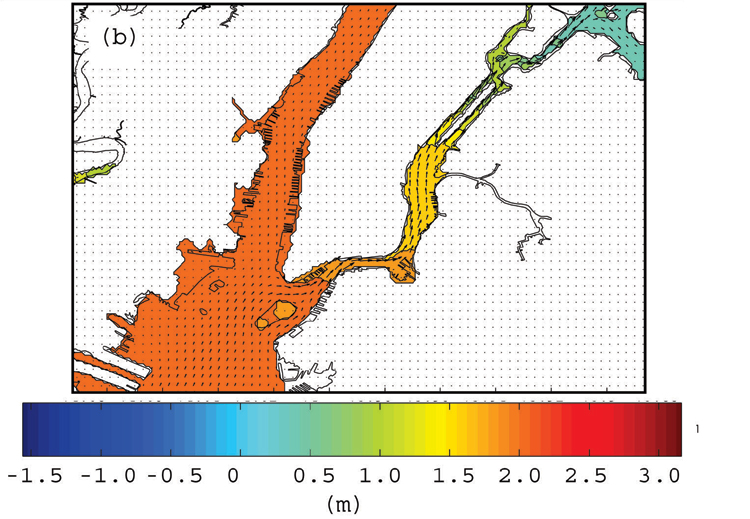
Caption (for two images below): Nor'easter, a and b
Figure. (a) 12-h forecast from the 12-km MM5 grid valid at 1200 UTC 11 December 1992 showing sea-level pressure (solid black every 2 mb), 2-m temperature (blue every 2 oC and shaded using scale), and winds (full barb = 10 kts). New York City is shown by the askerisk. (b) ADCIRC water level (color shaded in meters above MSL) and current vectors around Manhattan and New York Harbor at 1300 UTC 11 December 1992. Flooding is occurring over the seawall over portions of the south side of Manhattan at this time.
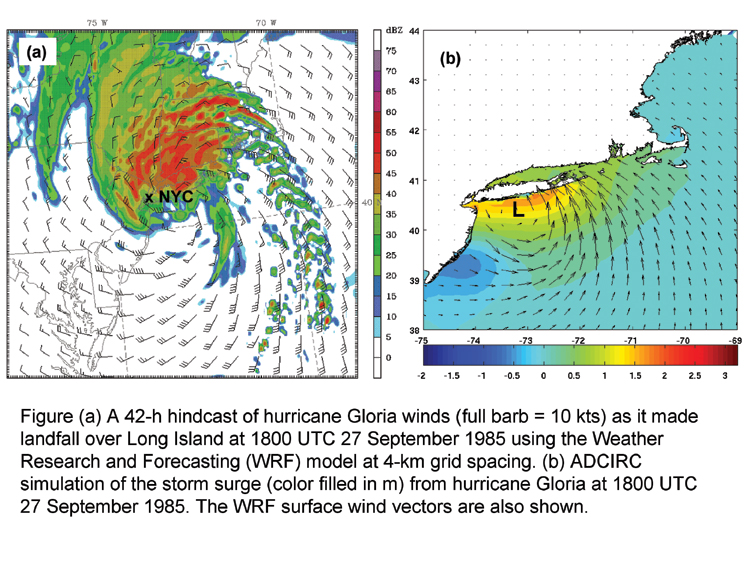
Caption (for three images below): Hurricane Gloria, a and b.
Using the Stony Brook Storm Surge model, Figure a shows sea-level pressure, surface winds and temperature around the time of flooding of the Battery in lower Manhattan (shown by *) during the December 1992 nor’easter. Figure b shows (in orange) how the model correctly predicted flooding around the tip of Manhattan (white).